Thursday, December 31, 2015

In this assignment we will use the function subplot(#rows,#columns,cell#) to compare the change in some distributions as there parameters change. subplot(#rows,#columns,cell#) creates multiple sub-fi gures within one g- ure. #rows tells the number of rows, #columns tells the number of columns, and cell# tells the sub- figure we are currently addressing

In this assignment we will use the function subplot(#rows,#columns,cell#)
to compare the change in some distributions as there parameters change.
subplot(#rows,#columns,cell#) creates multiple sub-fi gures within one g-
ure. #rows tells the number of rows, #columns tells the number of columns, and
cell# tells the sub- figure we are currently addressing.
For example:
vector X = [1:10];
subplot( 2,1,1 ), hist( vector X ), title( `Histogram' )
subplot( 2,1,2 ), bar( vector X ), title( `Bar Graph' )
Creates a 2 *1 figure.
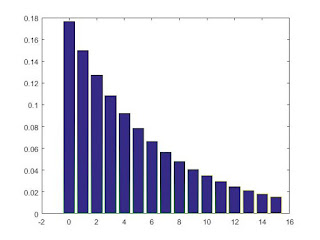
  • (1) Recreate the bar graph of the PMF of the Geometric Distribution from assignment 3 for p = 0:15; 0:33; 0:5; 0:66; 0:85 in one gure using subplot(). (Either 2 3 or 3 2, with one cell empty.) Title each subplot with the value of p.


Live Code:
sum = 0;
geoV1 = 1:15;
p= 0;
for y = 0:5
    if y == 1
     p =0.15;
    end
     if y ==2
    p=0.33;
     end
     if y == 3
         p =0.5;
        
     end
     if y == 4
         p = 0.66;
     end
     if y == 5
         p=0.85;
     end
    
for x =1:15
    geo = ((1-p)^(x-1)) * p;
    geoV1(x)= geo;
    result = geoV1;
if y == 1
    a = geoV1;
end
if y==2
    b = geoV1;
end
if y ==3
    c = geoV1;
end

if y == 4
    d = geoV1;
end

if y ==5
   e = geoV1;
end
   
  %subplot(2,1,2), hist(geoV1), title('Histogram')
end
end
geoV1;
subplot(2,3,1),bar(a), title 'p =0.15'
subplot(2,3,2),bar(b), title 'p =0.33'
subplot(2,3,3),bar(c), title 'p =0.50'
subplot(2,3,4),bar(d), title 'p =0.66'
subplot(2,3,5),bar(e), title 'p =0.85'

  • (2) rand(1,n) generates a 1 n vector of Uniformly Distributed data. Plot a histogram of such vectors of length 20, 40, . . . 180 (9 in total) using subplot. Title each subplot with the sample size.

Live Code:
v1 = rand(1,20);
v2 = rand(1,40);
v3 = rand(1,60);
v4 = rand(1,80);
v5 = rand(1,100);
v6 = rand(1,120);
v7 = rand(1,140);
v8 = rand(1,160);
v9 = rand(1,180);

subplot(3,3,1),hist(v1), title 'Size = 20'
subplot(3,3,2),hist(v2), title 'Size = 40'
subplot(3,3,3),hist(v3), title 'Size = 60'
subplot(3,3,4),hist(v4), title 'Size = 80'
subplot(3,3,5),hist(v5), title 'Size = 100'
subplot(3,3,6),hist(v6), title 'Size = 120'
subplot(3,3,7),hist(v7), title 'Size = 140'
subplot(3,3,8),hist(v8), title 'Size = 160'
subplot(3,3,9),hist(v9), title 'Size = 180'

  • (3) randn(1,n) generates a 1 n vector of Normally Distributed data. Plot a histogram of such vectors of length 20, 40, . . . 180 (9 in total) using subplot. Title each subplot with the sample size.

Live Code :
subplot(3,3,1),hist(randn(1,20)), title 'Size = 20'
subplot(3,3,2),hist(randn(1,40)), title 'Size = 40'
subplot(3,3,3),hist(randn(1,60)), title 'Size = 60'
subplot(3,3,4),hist(randn(1,80)), title 'Size = 80'
subplot(3,3,5),hist(randn(1,100)), title 'Size =100'
subplot(3,3,6),hist(randn(1,120)), title 'Size = 120'
subplot(3,3,7),hist(randn(1,140)), title 'Size = 140'
subplot(3,3,8),hist(randn(1,160)), title 'Size = 160'
subplot(3,3,9),hist(randn(1,180)), title 'Size = 180'


Plot a sphere, which is parametrically de ned as [x(t; s); y(t; s); z(t; s)] = [cos(t) cos(s); cos(t) sin(s); sin(t)] for t; s = [0; 2 ] (use surf).

Plot a sphere, which is parametrically de ned as [x(t; s); y(t; s); z(t; s)] =
[cos(t) cos(s); cos(t) sin(s); sin(t)] for t; s = [0; 2 ] (use surf).


Plot a funnel shaped spiral in 3D: [x; y; z] = [t sin(t); t cos(t); t] for t = [0; 10]. (Use plot3) Use an appropriate sampling to get smooth curves.

  • (4) Plot a funnel shaped spiral in 3D: [x; y; z] = [t sin(t); t cos(t); t] for t = [0; 10]. (Use plot3) Use an appropriate sampling to get smooth curves.

Plot the functions f(x) = x; g(x) = x3; h(x) = ex and z(x) = ex2over the interval [0; 4]. Use an appropriate sampling to get smooth curves. Describe your plots by using the functions: xlabel,ylabel,title.

  • (3) Plot the functions f(x) = x; g(x) = x3; h(x) = ex and z(x) = ex2over the interval [0; 4]. Use an appropriate sampling to get smooth curves. Describe your plots by using the functions: xlabel,ylabel,title.


Plot a circle with the radius r = 2, knowing that the parametric equation of a circle is [x(t); y(t)] = [rcos(t); rsin(t)] for t = [0; 2]

  • (2) Plot a circle with the radius r = 2, knowing that the parametric equation of a circle is [x(t); y(t)] = [rcos(t); rsin(t)] for t = [0; 2]


Make a plot connecting the coordinates: (2; 6); (2:5; 18); (5; 17:5); (4:2; 12:5) and (2; 12) by a line.

  • (1) Make a plot connecting the coordinates: (2; 6); (2:5; 18); (5; 17:5); (4:2; 12:5) and (2; 12) by a line.
    • Matlab code 


Wednesday, December 30, 2015

For this assignment you will plot the probability mass function and the cumula- tive distribution function of the binomial distribution an geometric distribution


Instructions
  • For assignment 2 we generated the pmf of the Binomial Distribution (recall: f(x) = (n choose x)( p^(x) ) *  (1 - p) (n - x) for x = 0; 1; 2; : : : ; 10, [in Matlab terms: f(x) = nchoosek( n, x ) * p^x * (1-p)^(n-x) ]).
  • For this assignment you will plot the probability mass function and the cumula-tive distribution function of the binomial distribution for p = 0:15; 0:33; 0:5; 0:66; 0:85 and n = 10. How does the shape change as a function of p?
  • The pmf of the Geometric Distribution is given as : f(x) = ((1- p)^(x-1 ))p [in Matlab: (1-p)^(x-1) * p], for x = 1; 2; : : :. Plot the probability mass function and the cumulative distribution function of a geometric distribution with p = 0:15; 0:33; 0:5; 0:66; 0:85 for x = 1; 2; : : : ; 15. How does the shape change as a function of p?
 Binomial Distribution
  • Binomial Probability Cumulative Distribution
1p =0.15

2p = 0.33

3p = 0.5

4p = 0.66

5p = 0.85
  • Binomial Probability Mass Function
1p = 0.15
2p =0.33

3p = 0.5

4p =0.66

  
Geometric Distribution 
  • Probability Cumulative function 


    • Probability Mass Function


MatLab problems

Problems
Write Matlab code that does the following:
(1) Create a vector of the numbers 1 to 100
(2) Create a vector of the even numbers between 1 and 49 in reverse order (that
is [48, 46, . . . , 2])
(3) Assign the matrix

 | 1 2 3 |
 | 4 5 6 |
 | 3 2 1 |

 to a variable a
(4) Add the rst column of a to the second column of a
(5) Add 3 to every element of a
(6) Add 3 to every element of the second row of a
(7) Assign the vector [5; 7; 11; 13; 17] to the variable x. Assign the vector
[1; 2; 3; 5; 7] to the variable y.
(8) Find the sum of the component-wise multiplication of x and y
(9) Raise each element of x to the power of the corresponding element in y
(10) Divide each element of x by the corresponding element in y
(11) Create a vector with the elements
  • [1; 1=2; 1=3; : : : ; 1=100]
  • [0; 1=2; 2=3; 3=4; : : : ; 99=100]
Answer
----------
%1
[1:100]

%2
[48:-2:1]

%3
a = [1 2 3; 4 5 6; 3 2 1]

%4
a(:,1) + a(:,2)

%5
a + 3

%6
a(2,:) = a(2,:) + 3

%7
x = [5 7 11 13 17]
y = [1 2 3 5 7]

%8
sum(x .* y)

%9
x .^ y

%10
x ./ y

%11
vector1 = 1 ./ [1:100];
vector2 = [0:99] ./ [1:100];

rats( vector1(1:3) )
rats( vector2(1:4) )

Refer to Exercise 8.5. Compute 10-year relative population change

8.7. Refer to Exercise 8.5. Compute 10-year relative population change y1 = (5.3 − 3.9)/3.9,
y2 = (7.2 − 5.3)/5.3, etc.
(a) Compute sample mean, median, and variance of the relative population change.
(b) Construct a time plot of the relative population change. What trend do you see now?
(c) Comparing the time plots in Exercises 8.6 and 8.7, what kind of correlation between
xi and yi would you expect? Verify by computing the sample correlation coefficient
What can you conclude? How would you explain this phenomenon?


a)        
Relative Population Mean =     0.2238
Relative population Median = 0.2097
Relative population variance = 0.0103

b) 


This plot basically show the relative rate of change in the population after each decade. It seems like the growth of the population is decreasing after each decade. This is not plotting the total number of the population, instead this plotting the relative rate of “increase of population”

c) While comparing the time plots in Exercises 8.6 and 8.7, I am expecting a negative correlation between xi and yi . Because if you look at the plot of 8.6, the value are increasing but the plot in example 8.7 show the value is decreasing.
Matlab gives me a negative value for correlation coefficient as expected =    -0.7884.